Quick start
This tutorial shows how to open and plot your data.
[11]:
import xarray_well_ice.xw_load as xwl
import xarray_well_ice.xw_tilt
import matplotlib.pyplot as plt
Piezometer
Load data from file
[3]:
adr_P='data/Planpincieux_2_Press.dat'
ds_p=xwl.load_xw_pressure(adr_P)
[4]:
ds_p
[4]:
<xarray.DataArray (time: 4291)> Size: 34kB
array([5.761, 5.76 , 5.762, ..., 5.882, 5.88 , 5.88 ])
Coordinates:
  * time     (time) datetime64[ns] 34kB 2024-06-13T12:55:00 ... 2024-08-06T05...
Attributes:
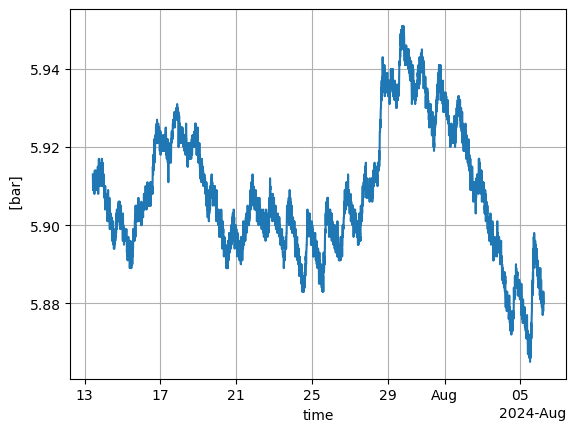
unit: barPlot pressure evolution with time
[8]:
ds_p.sel(time=slice("2024-07-13", "2024-08-06")).plot(label='presuure')
plt.grid()

Inclinometer
Load data from file
[10]:
adr_i='data/Planpincieux_2_Tilt.dat'
ds_i=xwl.load_xw_tilt(adr_i)
[16]:
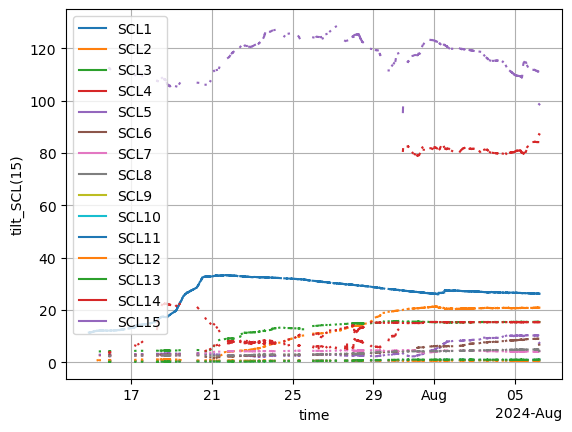
ds_i.sel(time=slice("2024-07-13", "2024-08-06")).xwt.plot_raw()
plt.grid()
plt.legend()
[16]:
<matplotlib.legend.Legend at 0x74b67adf74d0>

[ ]: